Market Intelligence
October 22, 2026

Market share tells you how much of a category you sell. Share of shelf tells you how much of it a shopper can see in the aisle. In home improvement, the second number has a habit of deciding the first.
A typical Home Depot store stocks more than 35,000 products. At every reset, a buyer decides how much of that space your brand gets, and they make the call with sales data from their own stores. Most manufacturers walk into that conversation knowing less about their own shelf than the buyer does.
This guide covers how to calculate share of shelf, how to compare it with your share of sales, why it's so hard to measure across thousands of stores, and what to do with the answer before your next line review.
Share of shelf is the percentage of a category's display space that one brand occupies. You calculate it by dividing your brand's space by the category's total space and multiplying by 100. Space can be measured in linear feet, facings, or SKU count, and in home improvement it should be measured store by store.
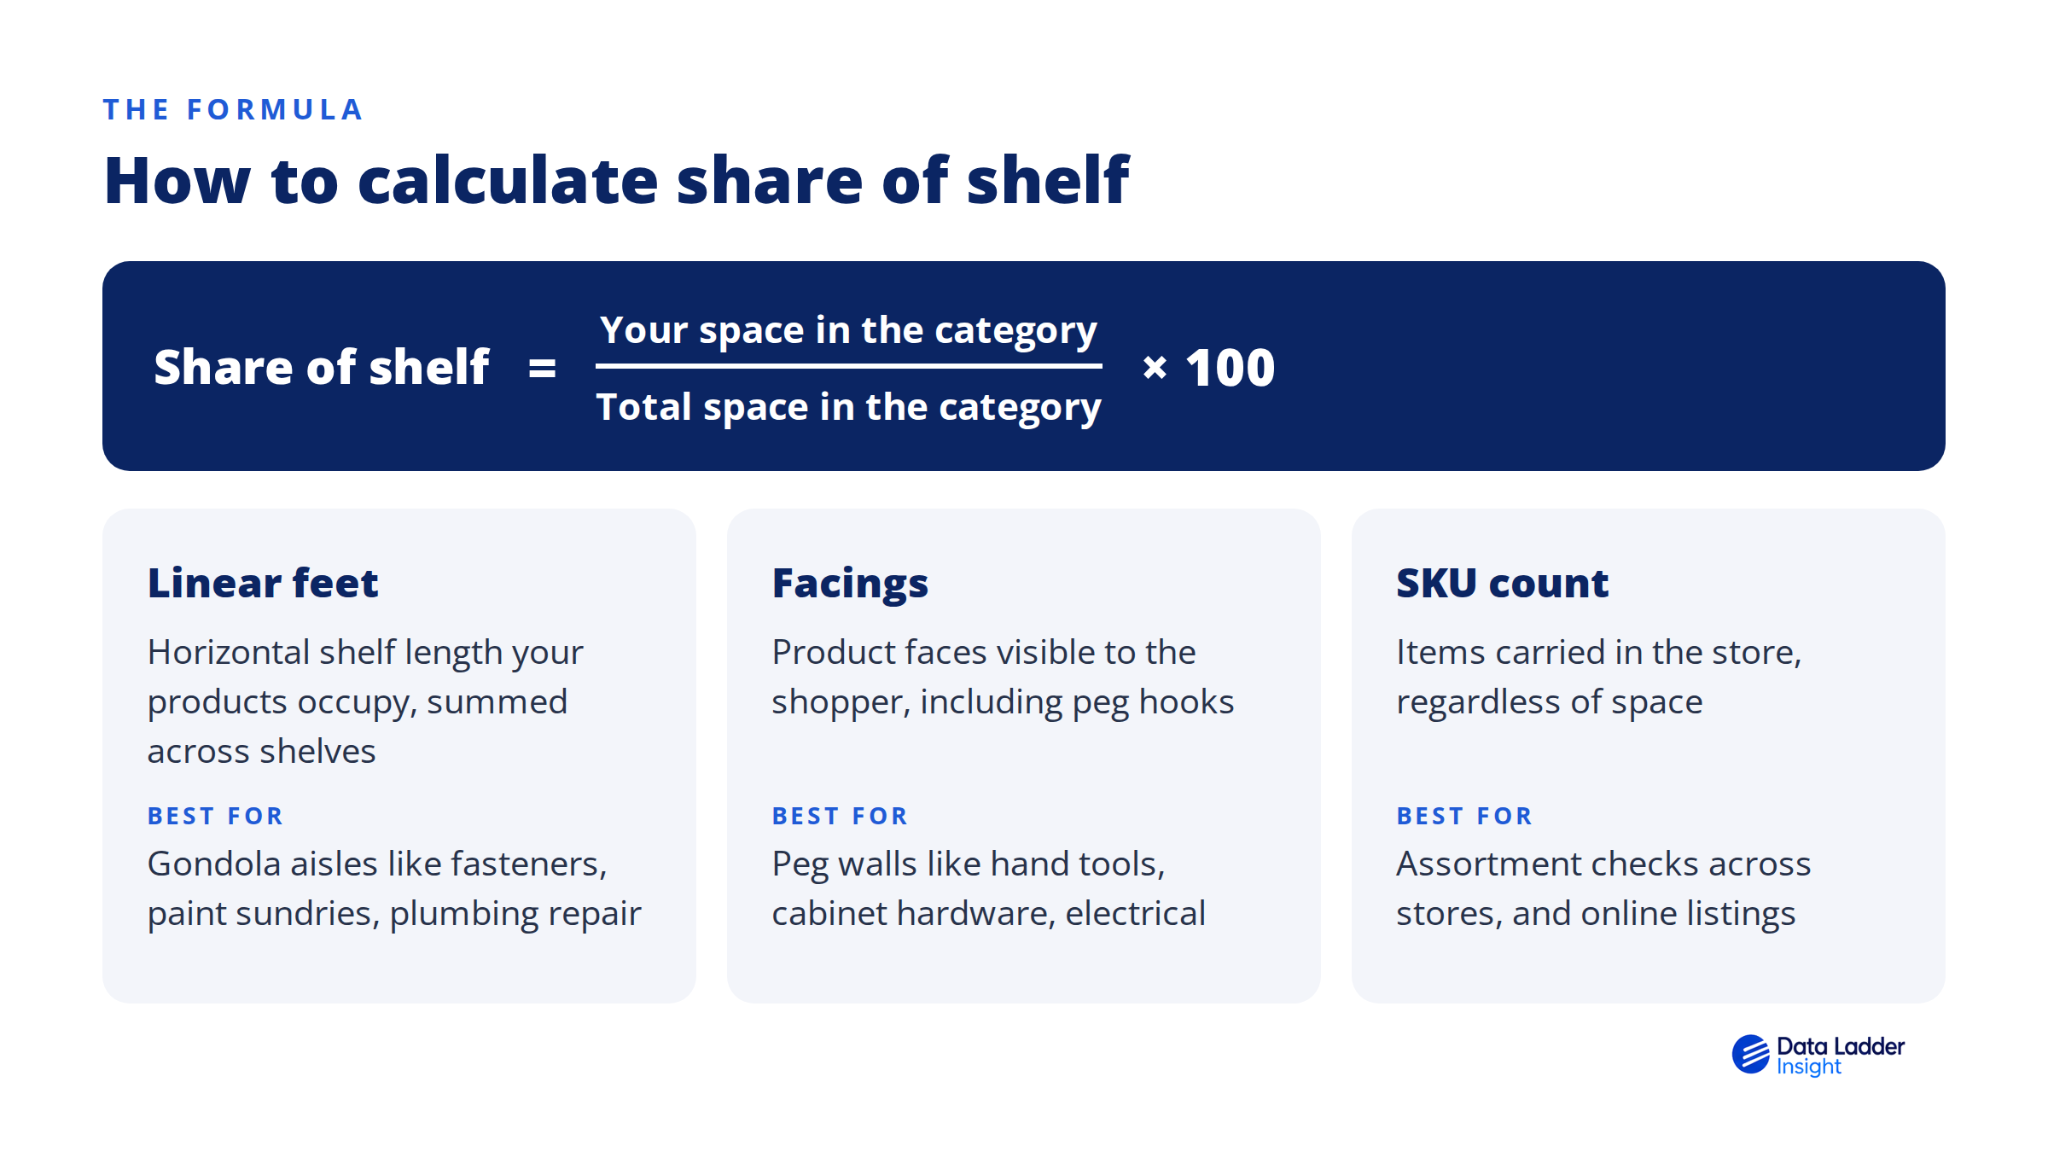
The math is simple. If a fastener aisle runs 48 linear feet and your products take up 12 of them, your share of shelf in that store is 25%. The hard part is choosing what to count, because a home improvement store mixes fixtures in a way a grocery aisle never does.
Hand tools hang on peg walls, so facings are the honest measure there. Paint sundries and plumbing repair sit on gondola shelving, where linear feet tell you more. Lumber, bagged concrete, and insulation sit in bays and on pallets, where neither unit works well and bay or pallet positions do the job better. Pick the unit that matches the fixture, and keep it consistent across stores. Changing units between categories makes a 25% share in one aisle impossible to compare with a 25% share in the next.
A 30% share of shelf could be generous or stingy. You can't tell until you put it next to how much of the category you actually sell in the same stores. That comparison is usually called fair share.
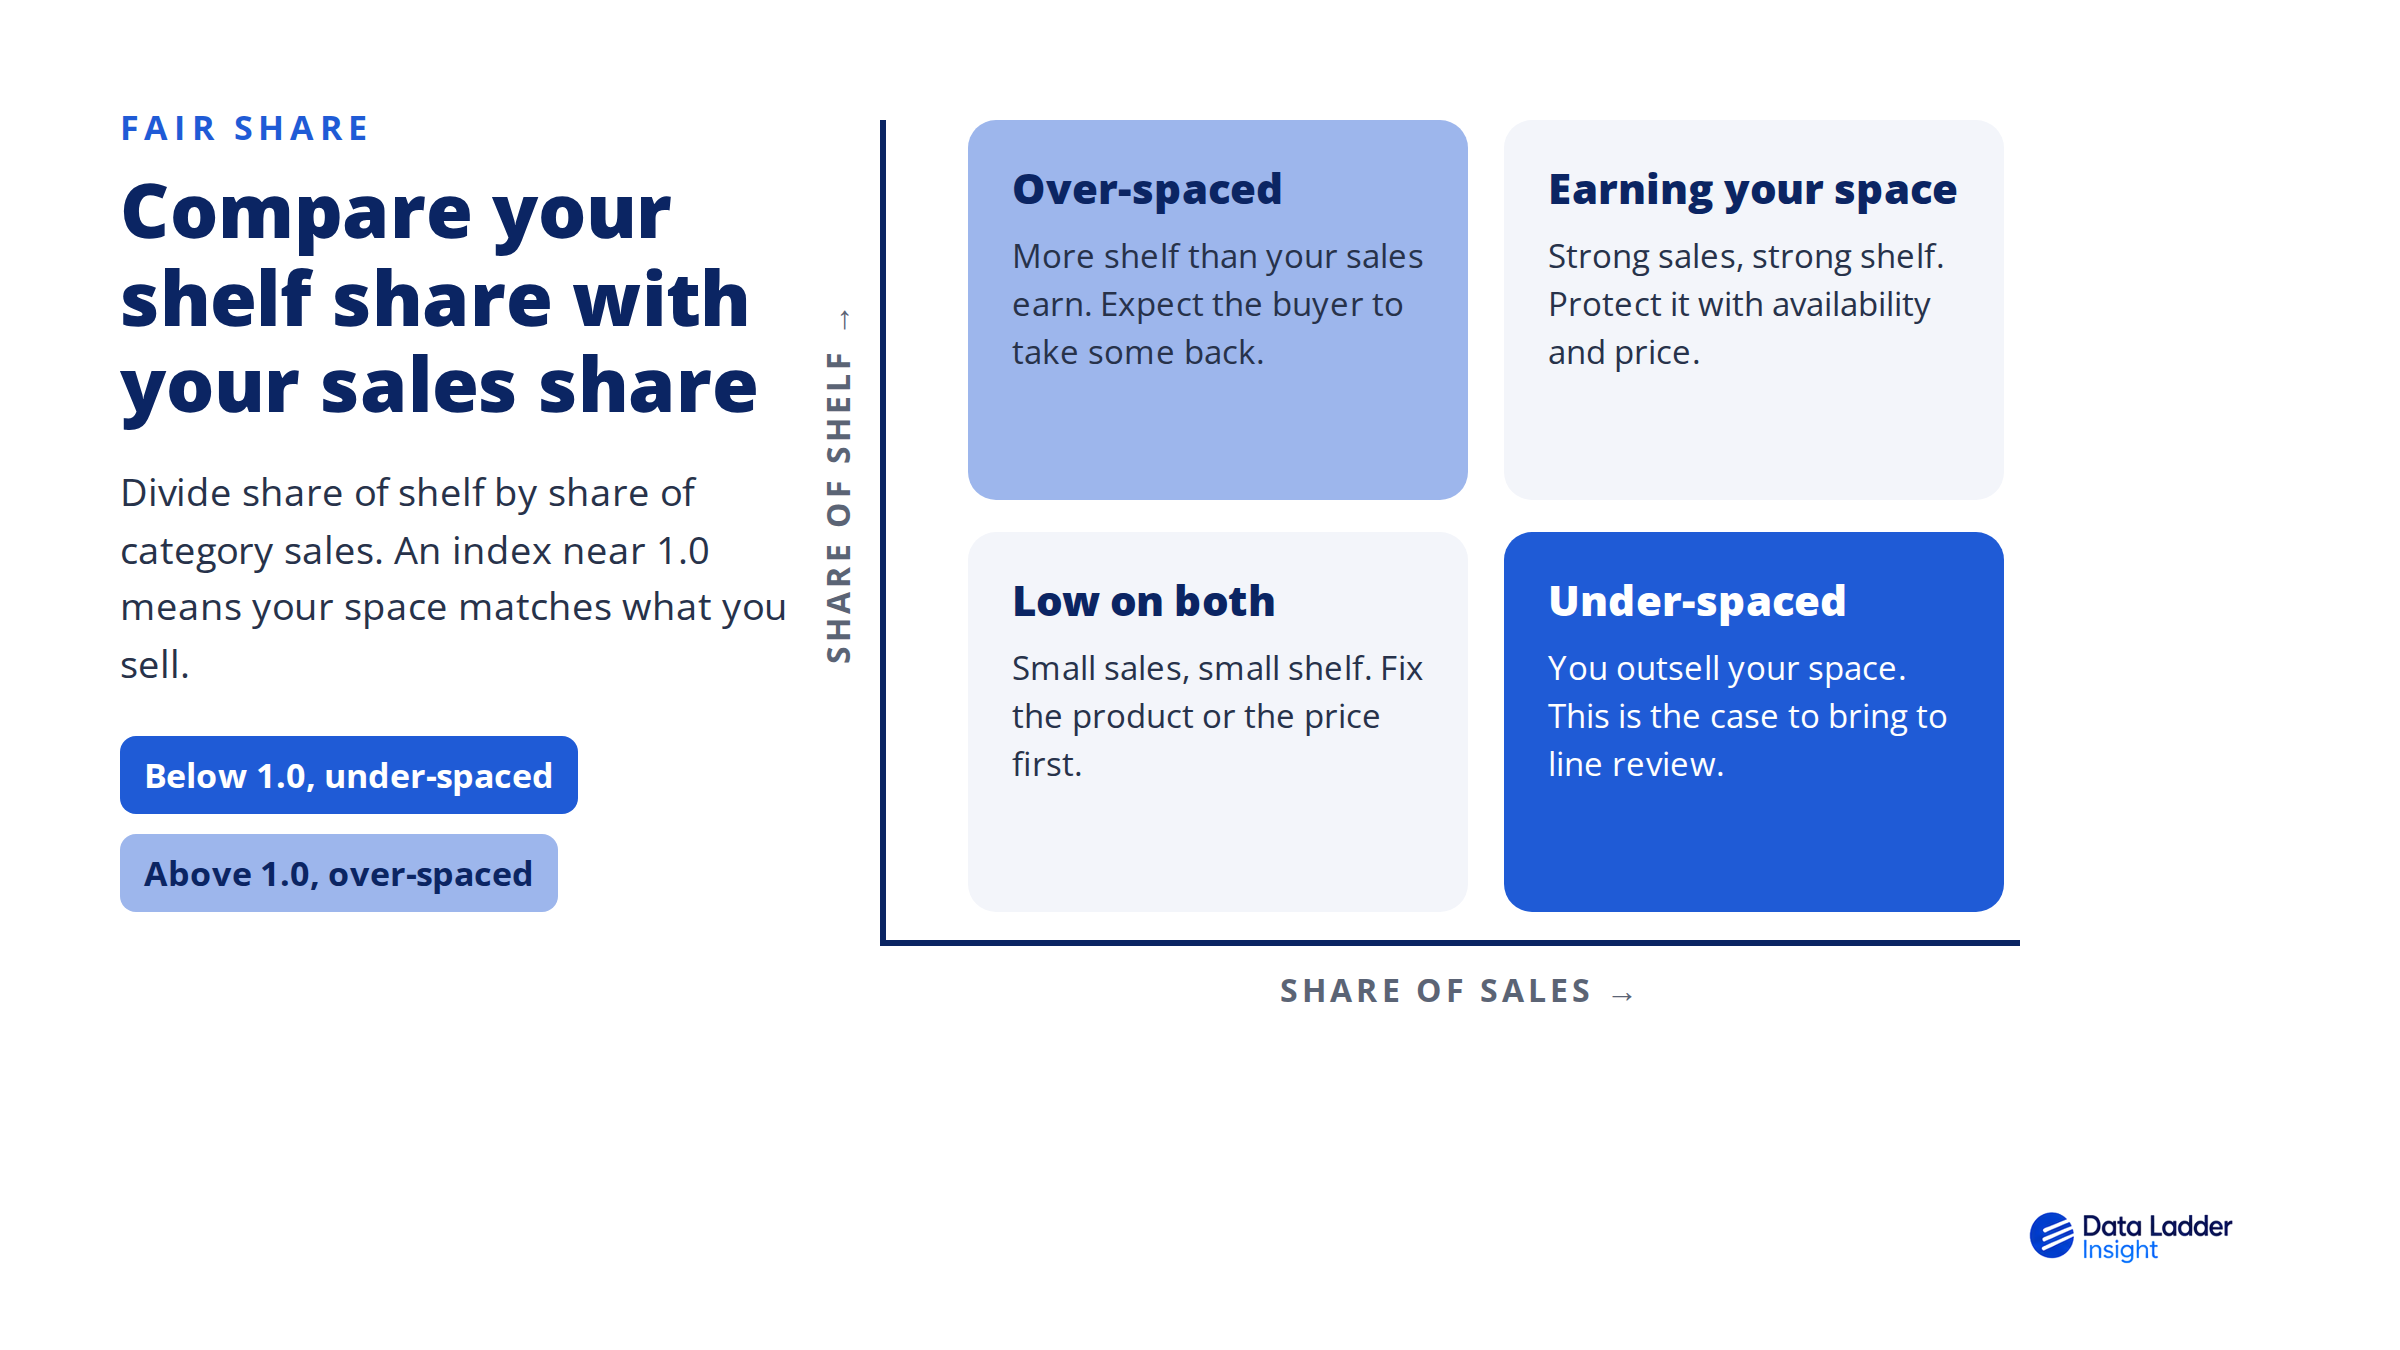
Fair share of shelf compares a brand's share of shelf with its share of category sales. Divide share of shelf by share of sales. An index near 1.0 means your space matches your sales. Below 1.0 means you're under-spaced, and above 1.0 means you're over-spaced.
Say your brand sells 18% of a category at Lowe's but holds 12% of the shelf. Your index is 0.67. You're outselling your space, and every shopper who can't find your product on a crowded peg wall is a sale the retailer is giving up.
Space also moves sales, and the research backs this up. A meta-analysis of 1,268 shelf space elasticity estimates published in the Journal of Retailing found an average elasticity of 0.17. On average, a 10% increase in shelf space comes with roughly a 1.7% increase in sales. The same study found that adding space moves sales more than taking it away does, which is one more reason to argue for space when you have the numbers.
We think under-spaced brands hold the strongest hand at a line review, because the argument is about the retailer's sales as much as yours. Over-spaced brands have a different job. They need to know it before the buyer does, and fix the sales side before the space gets taken back.
One caution on the sales side of the ratio: use your share at that retailer, in those stores. A national share figure blends every channel and region into one number, and it rarely matches your position at a single chain.
Grocery has its own problems, but a cereal aisle in Ohio looks a lot like a cereal aisle in Arizona. A home improvement aisle often doesn't, and that's where most share of shelf numbers go wrong.
Scale is the first problem. Home Depot ended its 2025 fiscal year with 2,021 stores in the 50 states and Washington, DC. Lowe's runs about 1,750. That's nearly 3,800 stores before you count Menards, regional chains, and independents. A national planogram flattens all of them into one picture.
The second problem is that the stores aren't meant to look the same. Retailers build planograms by store cluster, so a Minneapolis store gives snow blower space to a category that a Phoenix store gives to pool supplies. A store near a busy contractor base carries contractor packs and bulk quantities that a suburban DIY store doesn't. Your share of shelf can be 30% in one cluster and 8% in another, and the national average describes neither.
Seasonal resets add a third layer. Garden centers, outdoor power equipment, and grilling change space several times a year, so a share of shelf figure from spring can be wrong by summer.
The last problem is execution. The planogram agreed at line review is a plan. The shelf in a given store on a given Tuesday is what shoppers see, and the two drift apart through missed resets, stockouts that leave facings empty, and products shelved in the wrong spot. A share of shelf number built from planogram files measures the plan.
Home Depot lists about a million products online, against roughly 35,000 in a typical store. Online, space is effectively unlimited, so share of shelf comes down to position instead.
Digital share of shelf is the percentage of top search results a brand holds for a category's key search terms on a retailer's website. It's usually measured on the first page of results, tracked separately for sponsored and organic listings, and checked by zip code, since online availability changes by store.
Page one of a search for "cordless drill" on homedepot.com is the online version of the eye-level shelf. Pages three and four are the bottom shelf behind the end cap. If your products sit there, your listing exists but few shoppers will see it.
Two details make online shelf share easy to misread. Search results change by location, because they reflect stock at the shopper's local store. A product that's out of stock locally can drop down the page or show as unavailable, so a store-level stock problem becomes an online visibility problem too. Sponsored placements also crowd the top of the page, so a brand can lead on paid listings while losing organic positions. Track the two separately, or you'll mistake a strong ad budget for a strong shelf.
Most teams use a mix of the sources below. Each one answers part of the question, and the gaps between them are where share gets lost without anyone noticing.
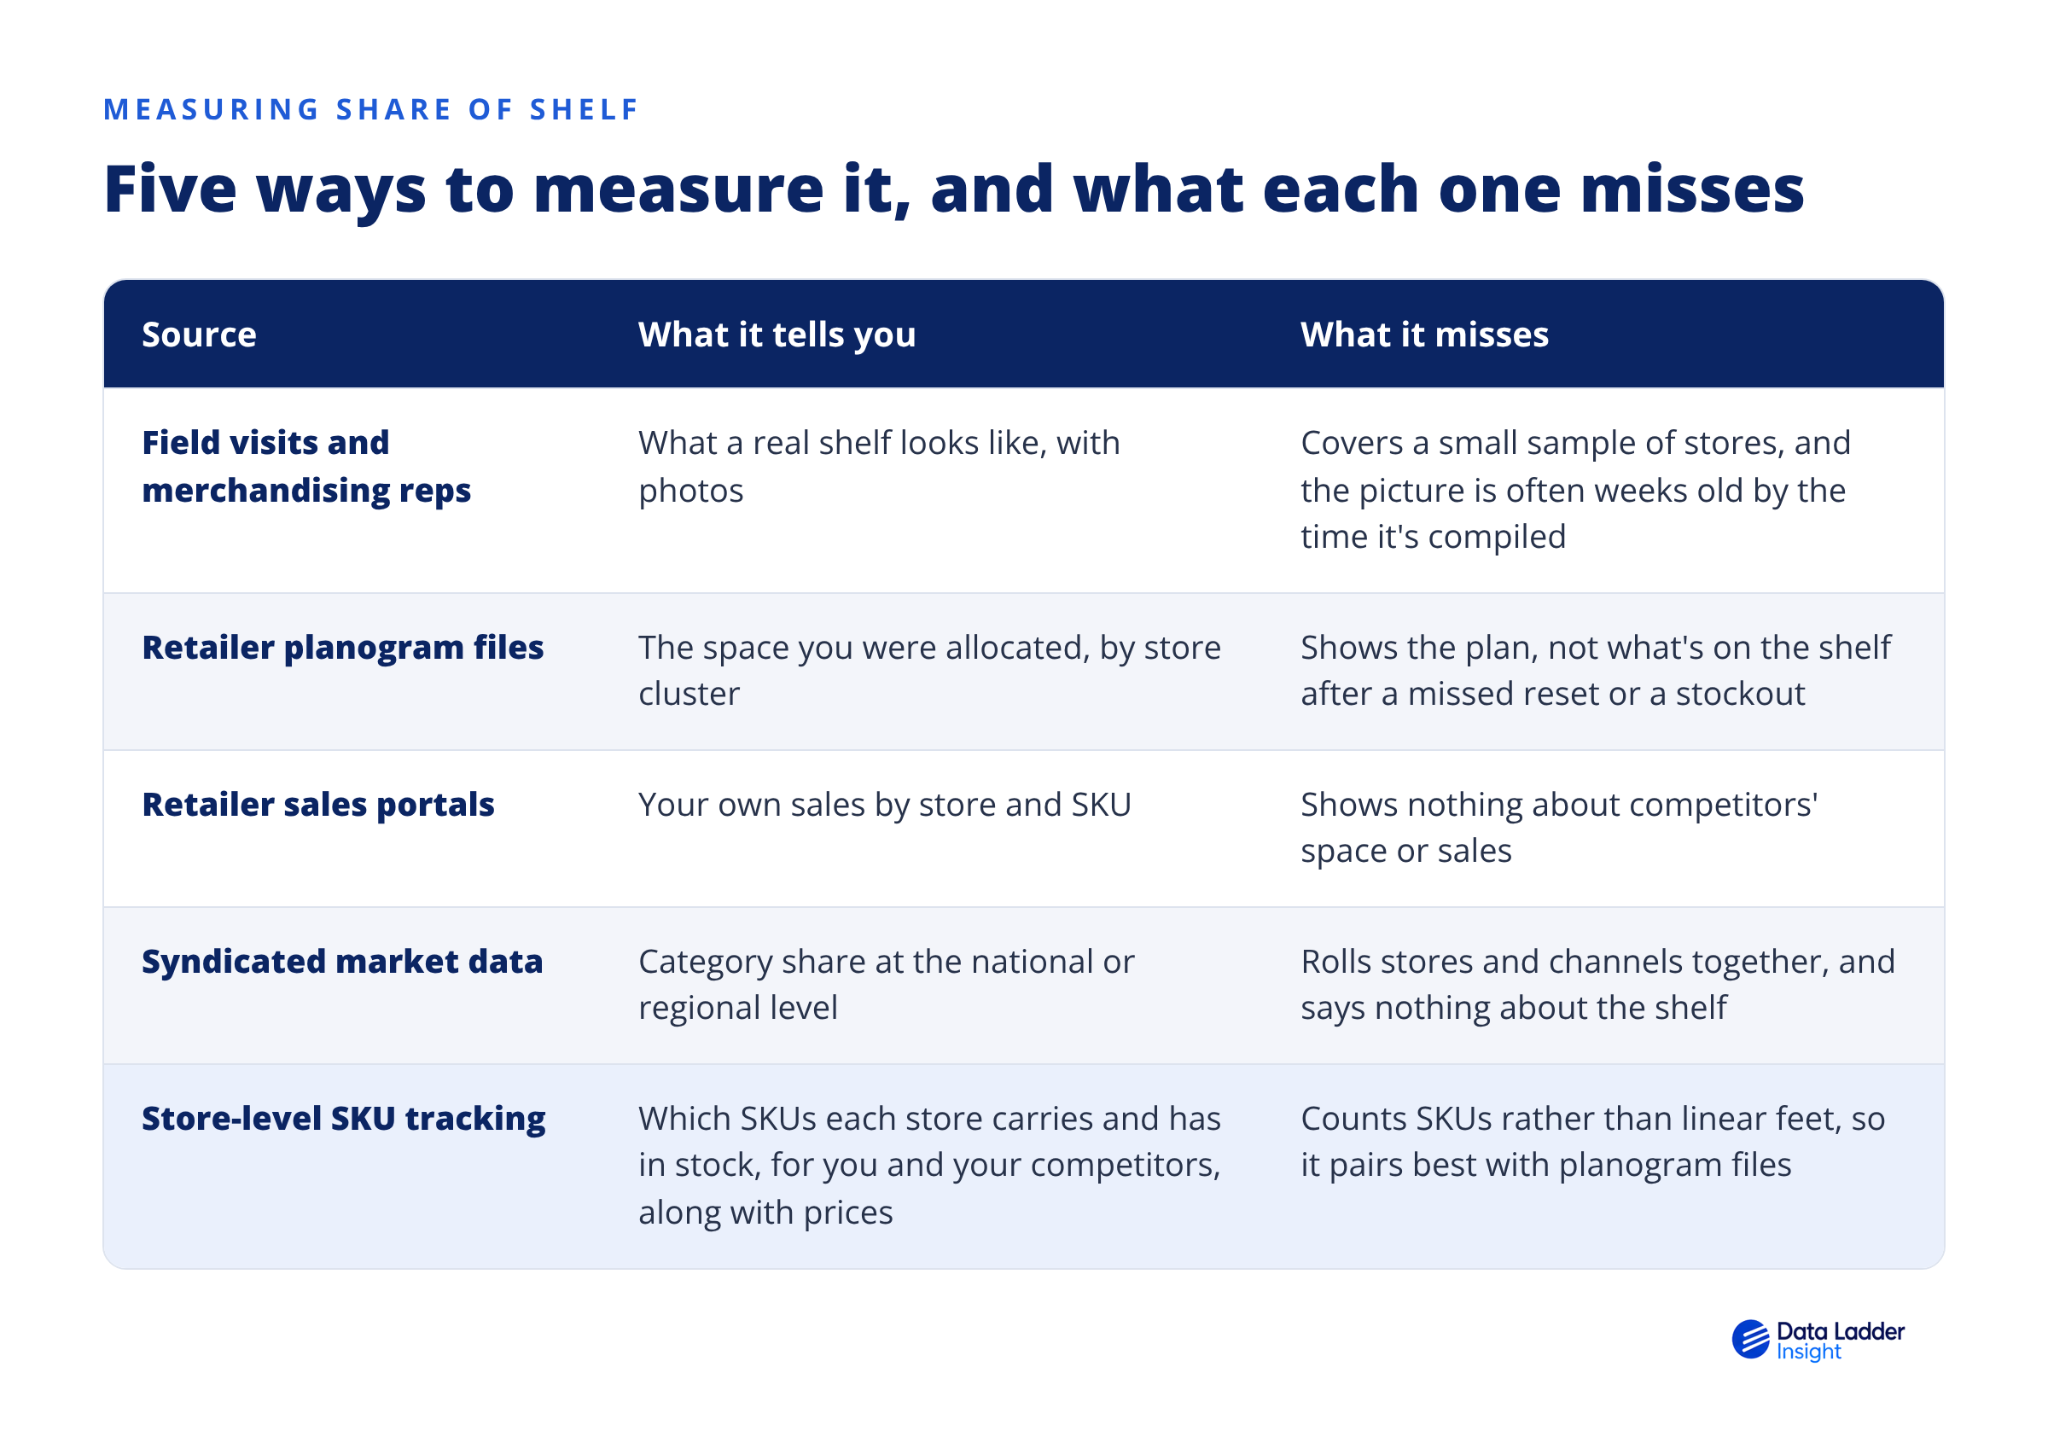
The first four sources were never built to answer a share of shelf question. Field visits see the shelf but only a few stores at a time. Planograms cover every store but only show intent. Sales portals and syndicated data measure sales instead of space.
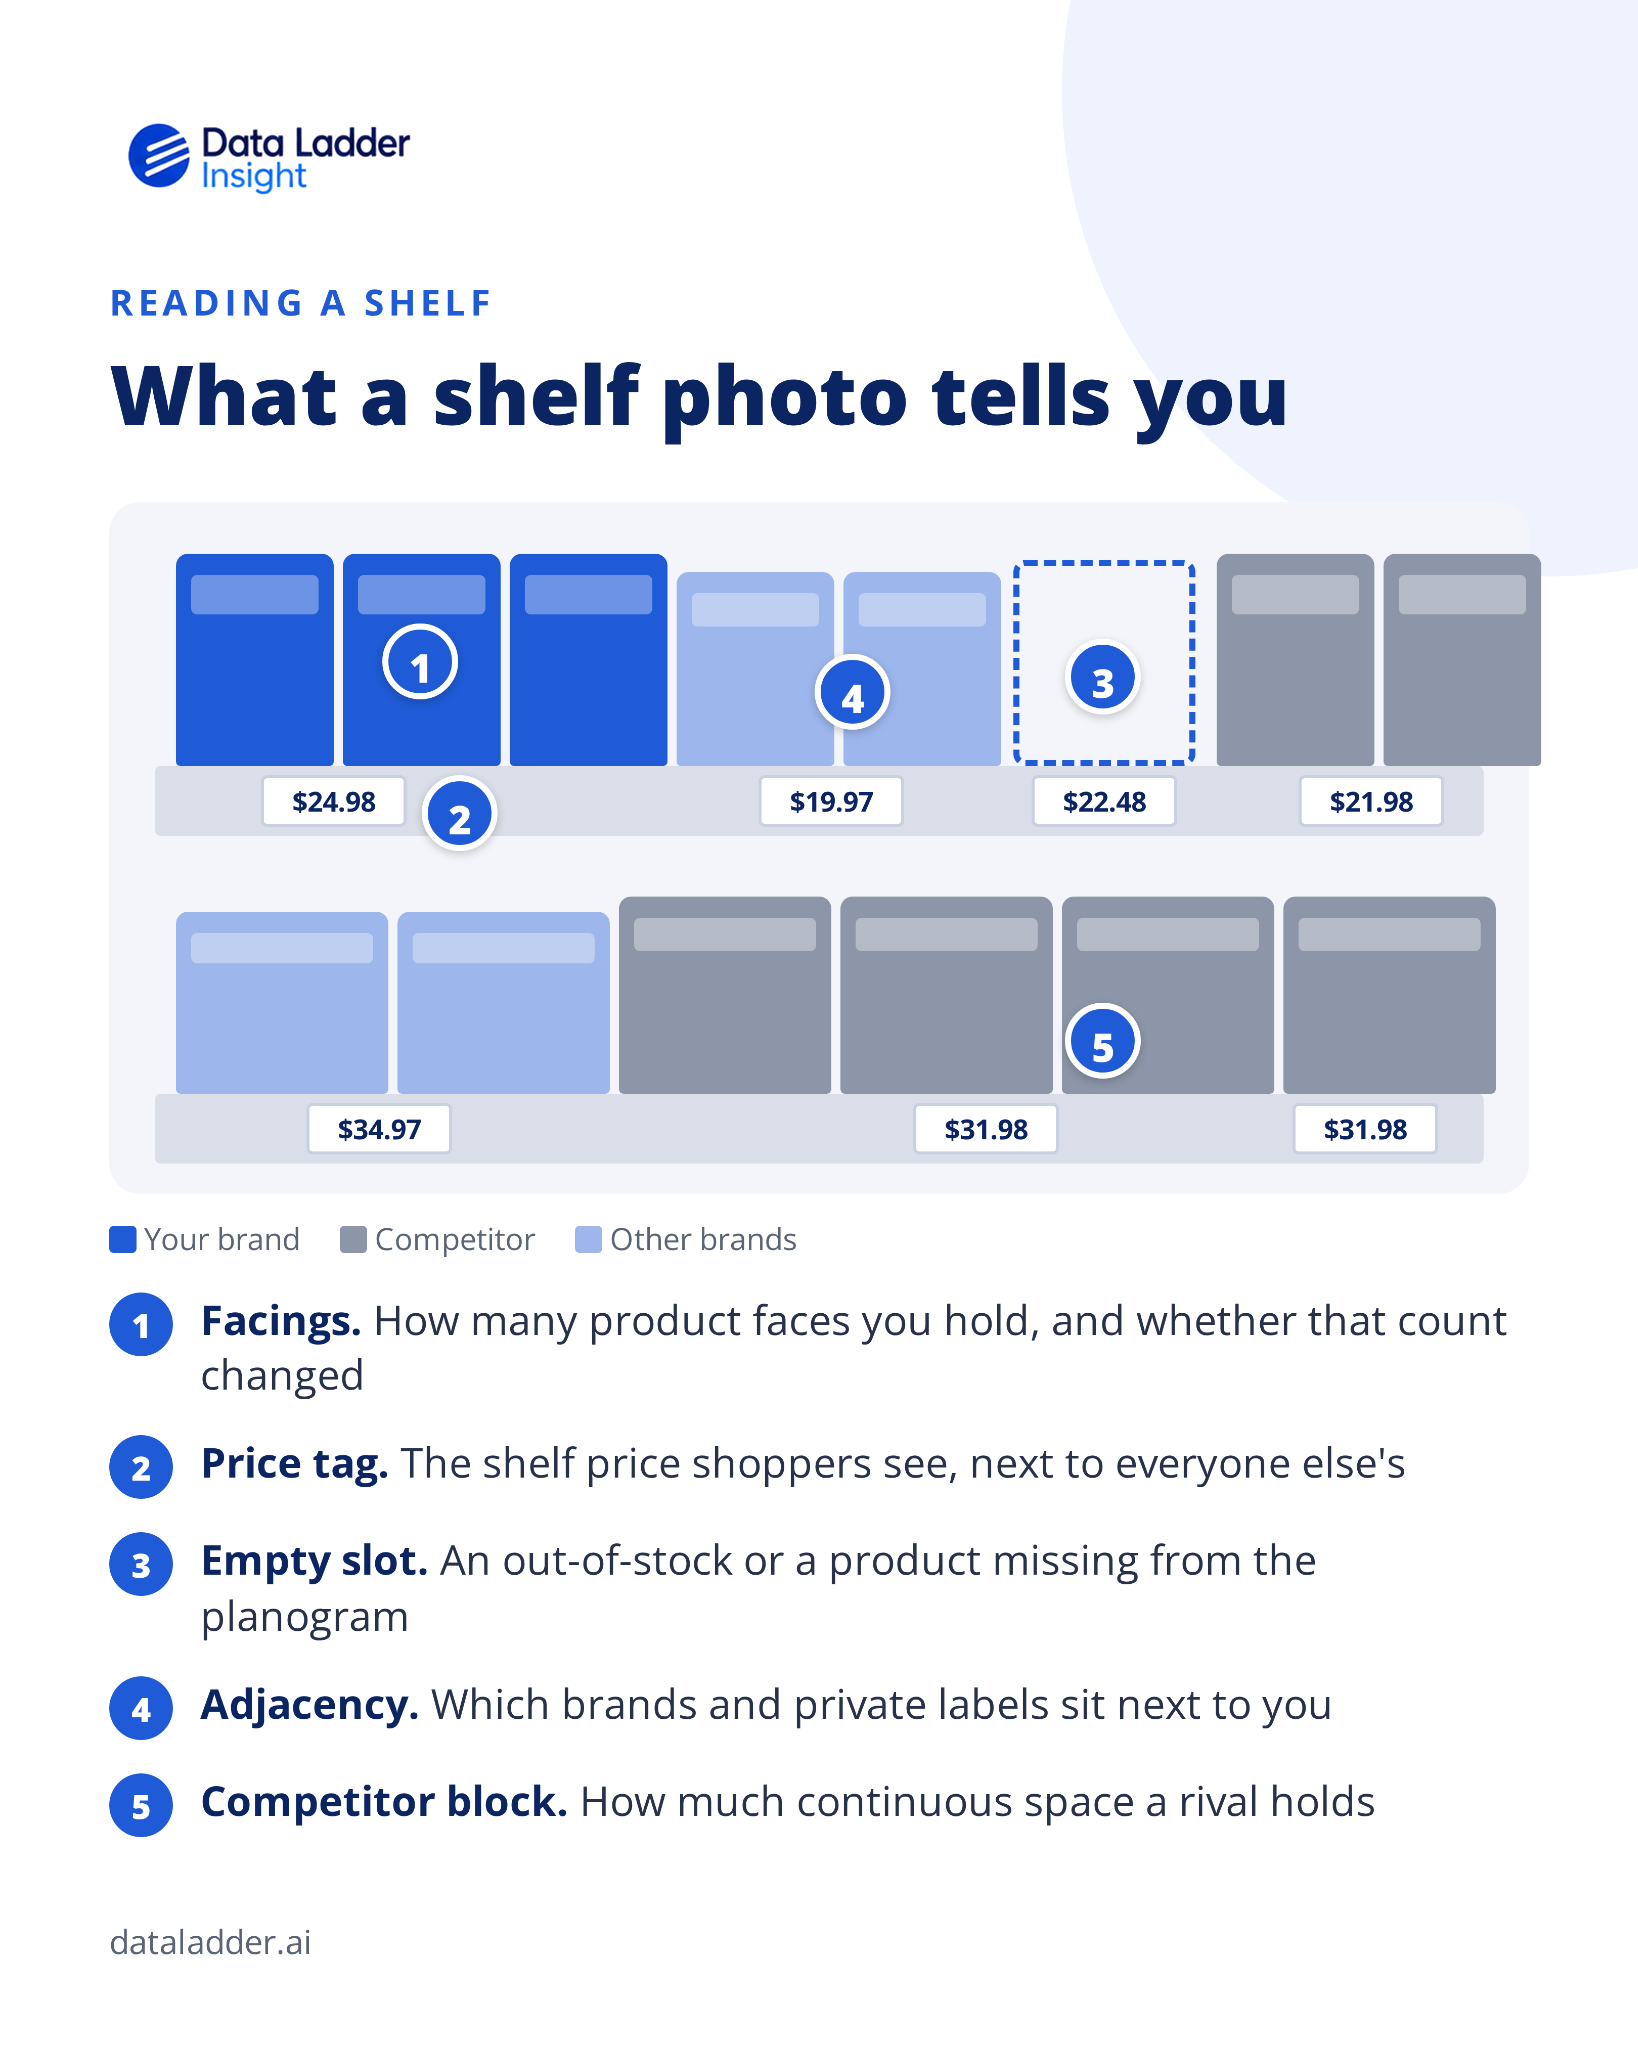
Store-level SKU tracking fills the biggest gap, which is coverage. Data Ladder Insight tracks pricing, inventory, and assortment for every SKU across 24,000+ U.S. retail and online locations, in both Pro and DIY channels, every day. Store by store, you can see which of your SKUs are carried, which are in stock, and what competitors carry beside them. Pair that with the planogram file and you can tell whether a low share is a space problem or an execution problem.
Share of shelf is decided in a few meetings a year. These are the moves that give a manufacturer the most to work with when those meetings come around.
Buyers think in sales per foot of shelf. If your fair share index at that retailer is below 1.0, show it by store cluster, with the stores where you outsell your space at the top. That reframes the request. You're showing the buyer where their own category is leaving sales on the shelf, which is a much easier conversation than asking for more space.
An empty facing is the easiest space for a buyer to take away, and a store that keeps running out of your SKU is evidence against you at the next reset. Check in-stock rates by store before the line review. If a cluster of stores keeps selling through, show that too, because it suggests the space is too small for the demand.
A national request for 10% more space is easy to refuse. A request for two more facings in the 300 stores where you outsell your space by the widest margin is specific, testable, and much harder to say no to. Retailers already plan by cluster, so meet them there.
Buyers add space for products that bring new sales to the category, rather than shifting sales from one brand to another. If attribute-level data shows a size, material, or feature with growing demand and no product on the shelf, that's a reason to add space rather than reshuffle it. We covered how to find these gaps in how product attributes reveal whitespace opportunities.
Share of shelf rarely drops all at once. It goes a facing at a time, often to a private label item priced just below yours or a competitor's new SKU at the next reset. Track what sits beside your products and at what price, store by store, so you see the squeeze while there's still time to answer it.
Share of shelf is one of the few numbers a manufacturer can bring to a line review that's about the retailer's business as much as their own. On its own, it's a percentage. Next to your share of sales, store by store, it becomes an argument a buyer has to answer.
The brands that win space at the next reset will be the ones who know their shelf as well as the buyer does, in every store and on page one of the retailer's website. The rest will find out what changed when the new planogram arrives.
If you want to see your SKU-level assortment, availability, and pricing across 24,000+ U.S. retail and online locations, book a walkthrough with the Insight team.
Divide the space your brand occupies in a category by the category's total space, then multiply by 100. Space can be measured in linear feet, facings, or SKU count. In home improvement, use the unit that matches the fixture (facings for peg walls, linear feet for gondola shelving) and measure store by store, since space varies by store cluster.
There's no universal good number. A good share of shelf is one that matches or exceeds your share of category sales at the same retailer. Divide share of shelf by share of sales. A result near 1.0 is fair share. Below 1.0 means you're under-spaced and have a case for more facings at the next reset.
Market share measures how much of a category's sales your brand captures. Share of shelf measures how much of the category's display space your brand occupies. The two are related, since more space tends to drive more sales, but they often diverge. Comparing them shows whether your space matches your sales.
Digital share of shelf is the percentage of top search results your brand holds for a category's key search terms on a retailer's website, such as homedepot.com or lowes.com. Measure it on the first page of results, track sponsored and organic listings separately, and check it by location, since online availability varies by store.
At a minimum, measure it before every line review and after every reset. Seasonal categories like garden, outdoor power equipment, and grilling change space several times a year and need more frequent checks. Ongoing, store-level tracking catches missed resets and stockouts while there's still time to fix them.


Talk to our team about how SKU-level visibility can help your business.


Copyright © Insight 2026