Market Intelligence
October 22, 2026

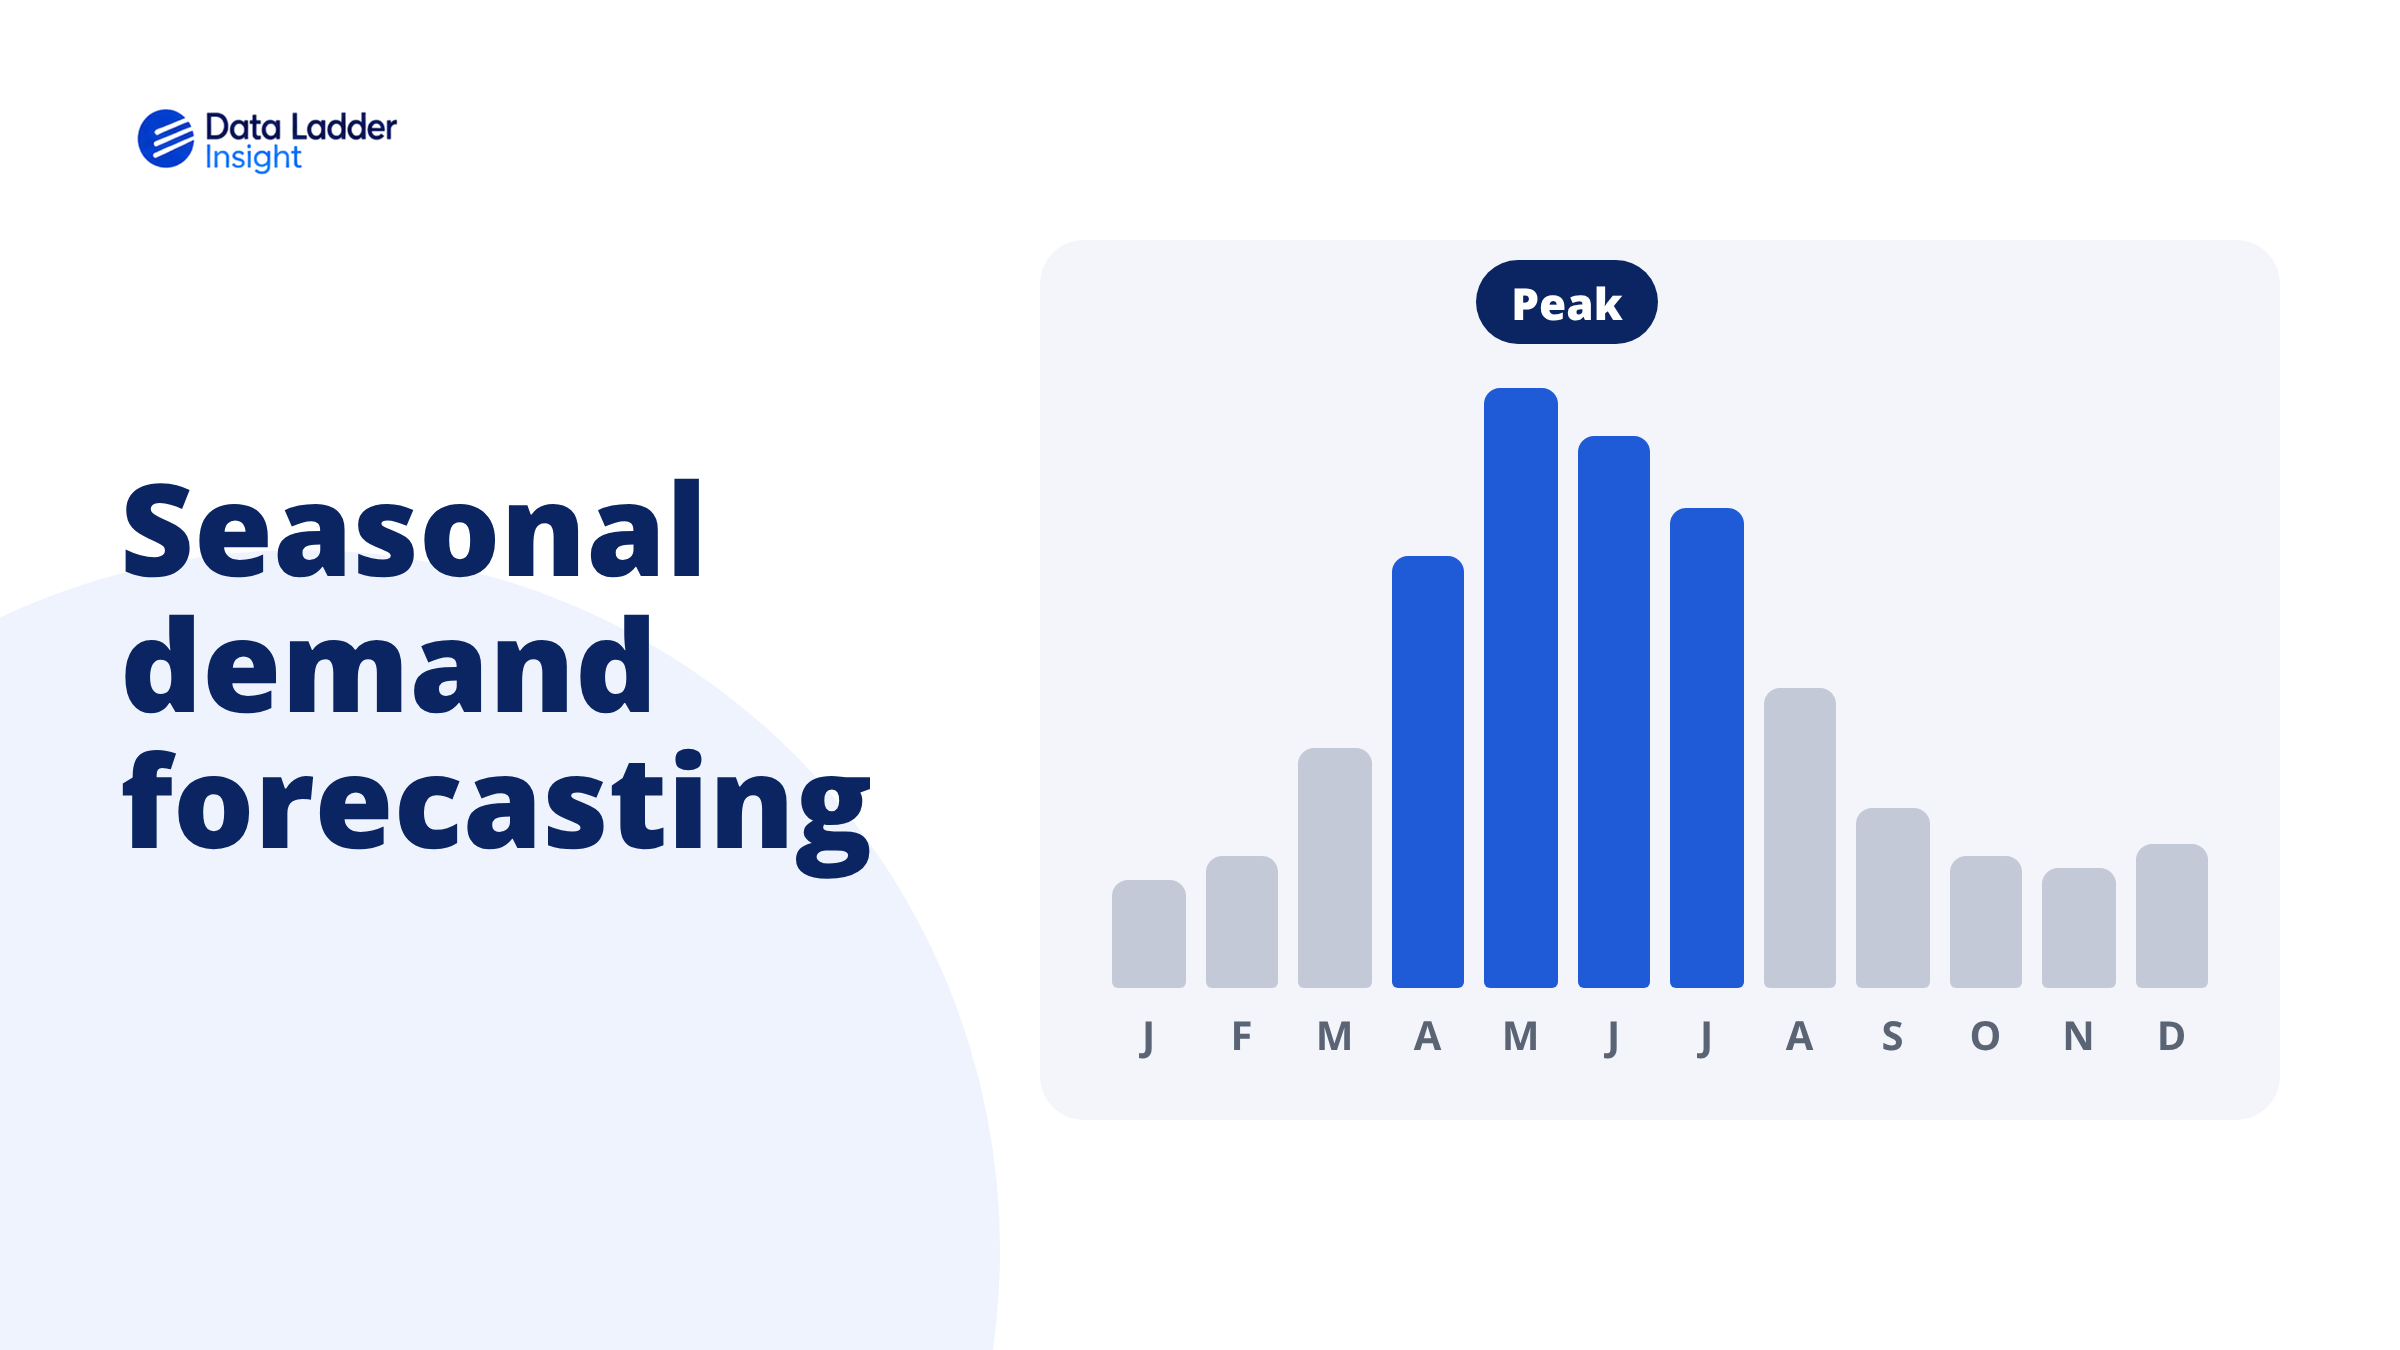
Home improvement runs on a short calendar. Home Depot's annual report says its highest sales volume generally comes in its second fiscal quarter, which runs roughly May through July. For a manufacturer selling grilling, garden, outdoor power equipment, or exterior paint, a few weeks of spring and early summer decide the year.
Seasonal demand forecasting is how you size that window before it opens. The trouble is timing. Most of the decisions that shape a season are made in the fall and winter, using data from the season before. By the time the first warm weekend shows you what demand really looks like, production is set, retailer orders have shipped, and the promotional calendar is locked.
This guide covers what a seasonal forecast should be built on, why last year's numbers mislead, which signals matter in the first weeks of the season, how to turn a forecast into a plan that can still move when the season does, and how Data Ladder Insight gives you a daily, store-level read on the season while there's still time to act on it.
Seasonal demand forecasting is the estimate of how much of a product shoppers will buy during a recurring peak, such as spring for garden and grilling or fall for heating and weatherization.
For a manufacturer selling through retail, it should estimate sell-through at the shelf, by retailer and region, rather than the orders retailers will place.
Manufacturers naturally forecast what they ship, because shipments are the number they see. But a retailer's order is already a forecast. It reflects the retailer's own view of demand, plus how much inventory they want to carry and how much they still have from last year. Forecasting orders means forecasting someone else's forecast, with their mistakes built in.
This is the gap Data Ladder Insight was built to close. Instead of your own shipments, it shows what's selling, what's in stock, and what it's priced at for every SKU across 24,000+ U.S. retail and online locations, in both Pro and DIY channels, refreshed daily. That gives you a forecast built on shopper demand at the shelf rather than on a retailer's order.
A useful seasonal forecast answers three separate questions, and each one drives a different decision.
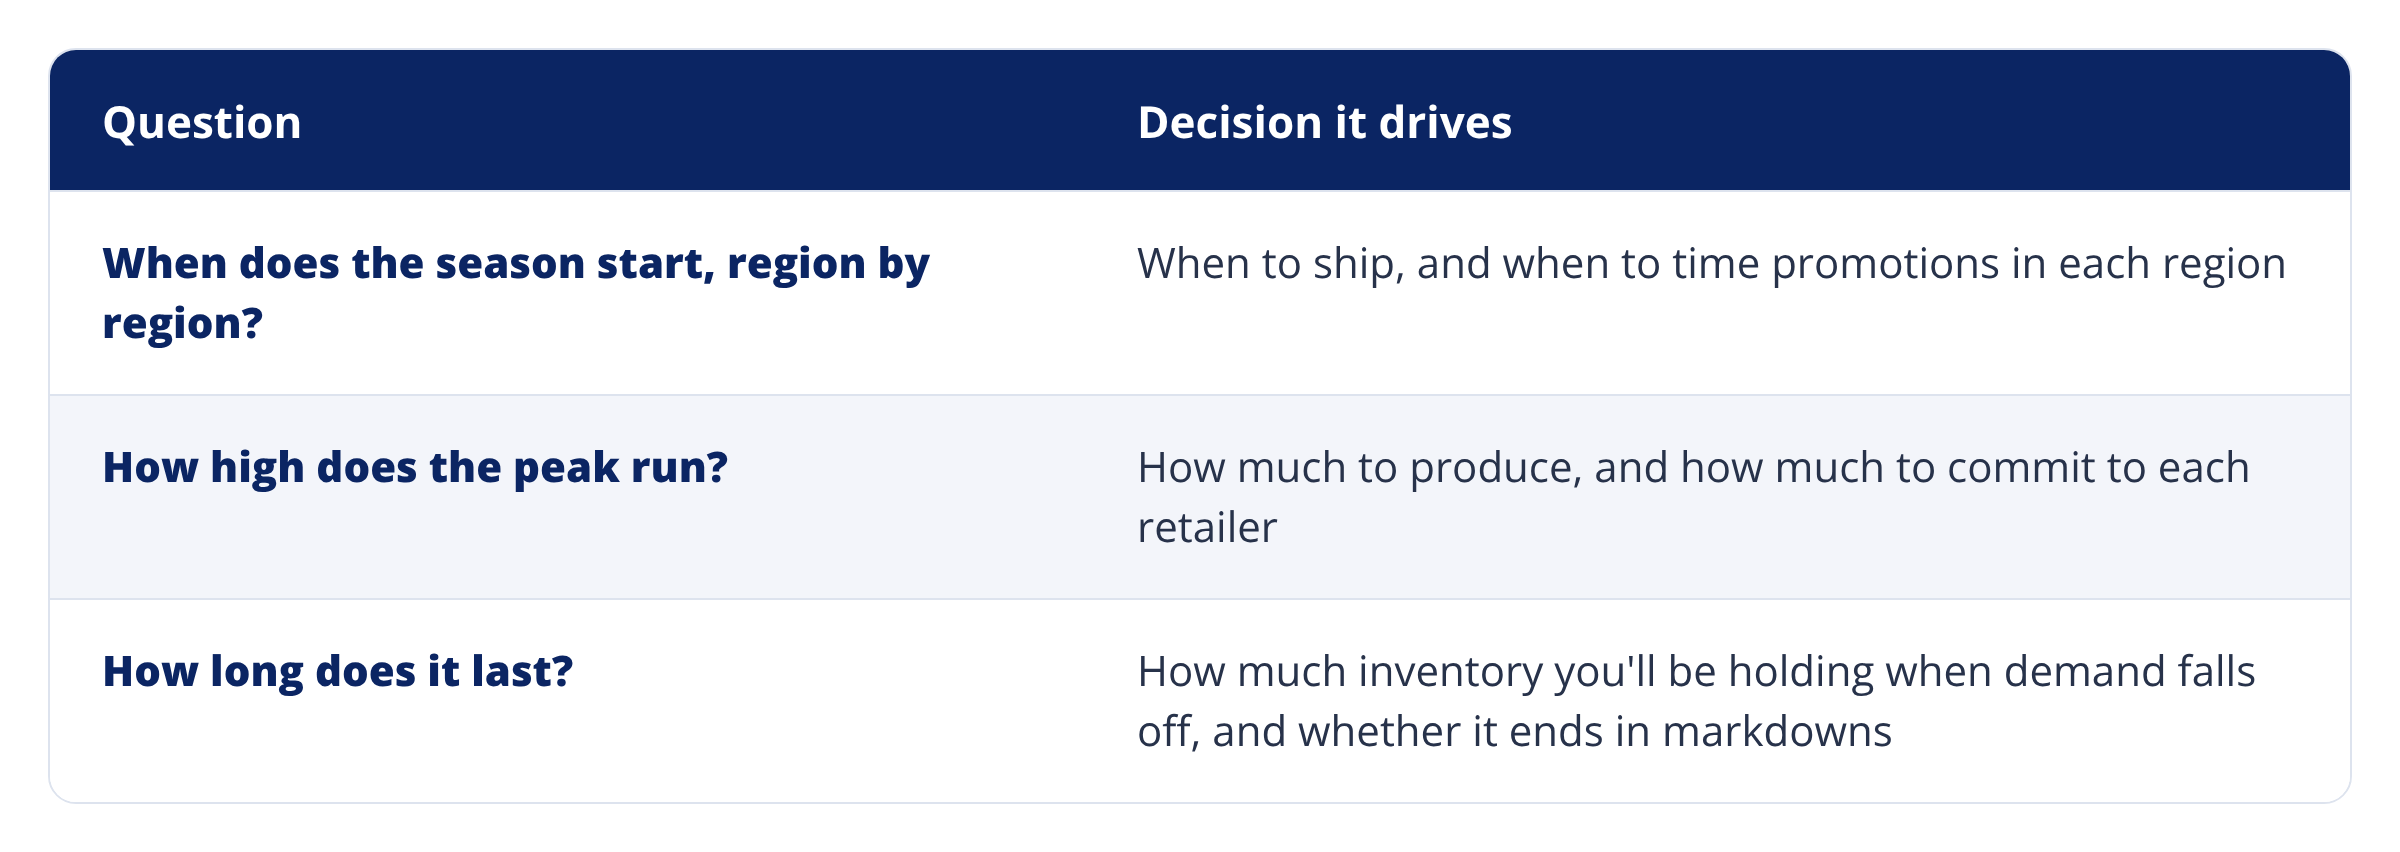
A forecast that gets the total right but the timing wrong can still leave you out of stock in April and overstocked in July. For a seasonal category, getting the timing right matters as much as getting the total right.
For a spring and summer category, the season's biggest calls are made while the stores are still selling snow shovels. Assortment is set at line review the fall before. Production is committed over the winter, and for products sourced overseas, the lead time leaves little room to change course. Retailer orders ship in the first months of the year so stores are set before the first warm weekend, and the promotional calendar is agreed well in advance.
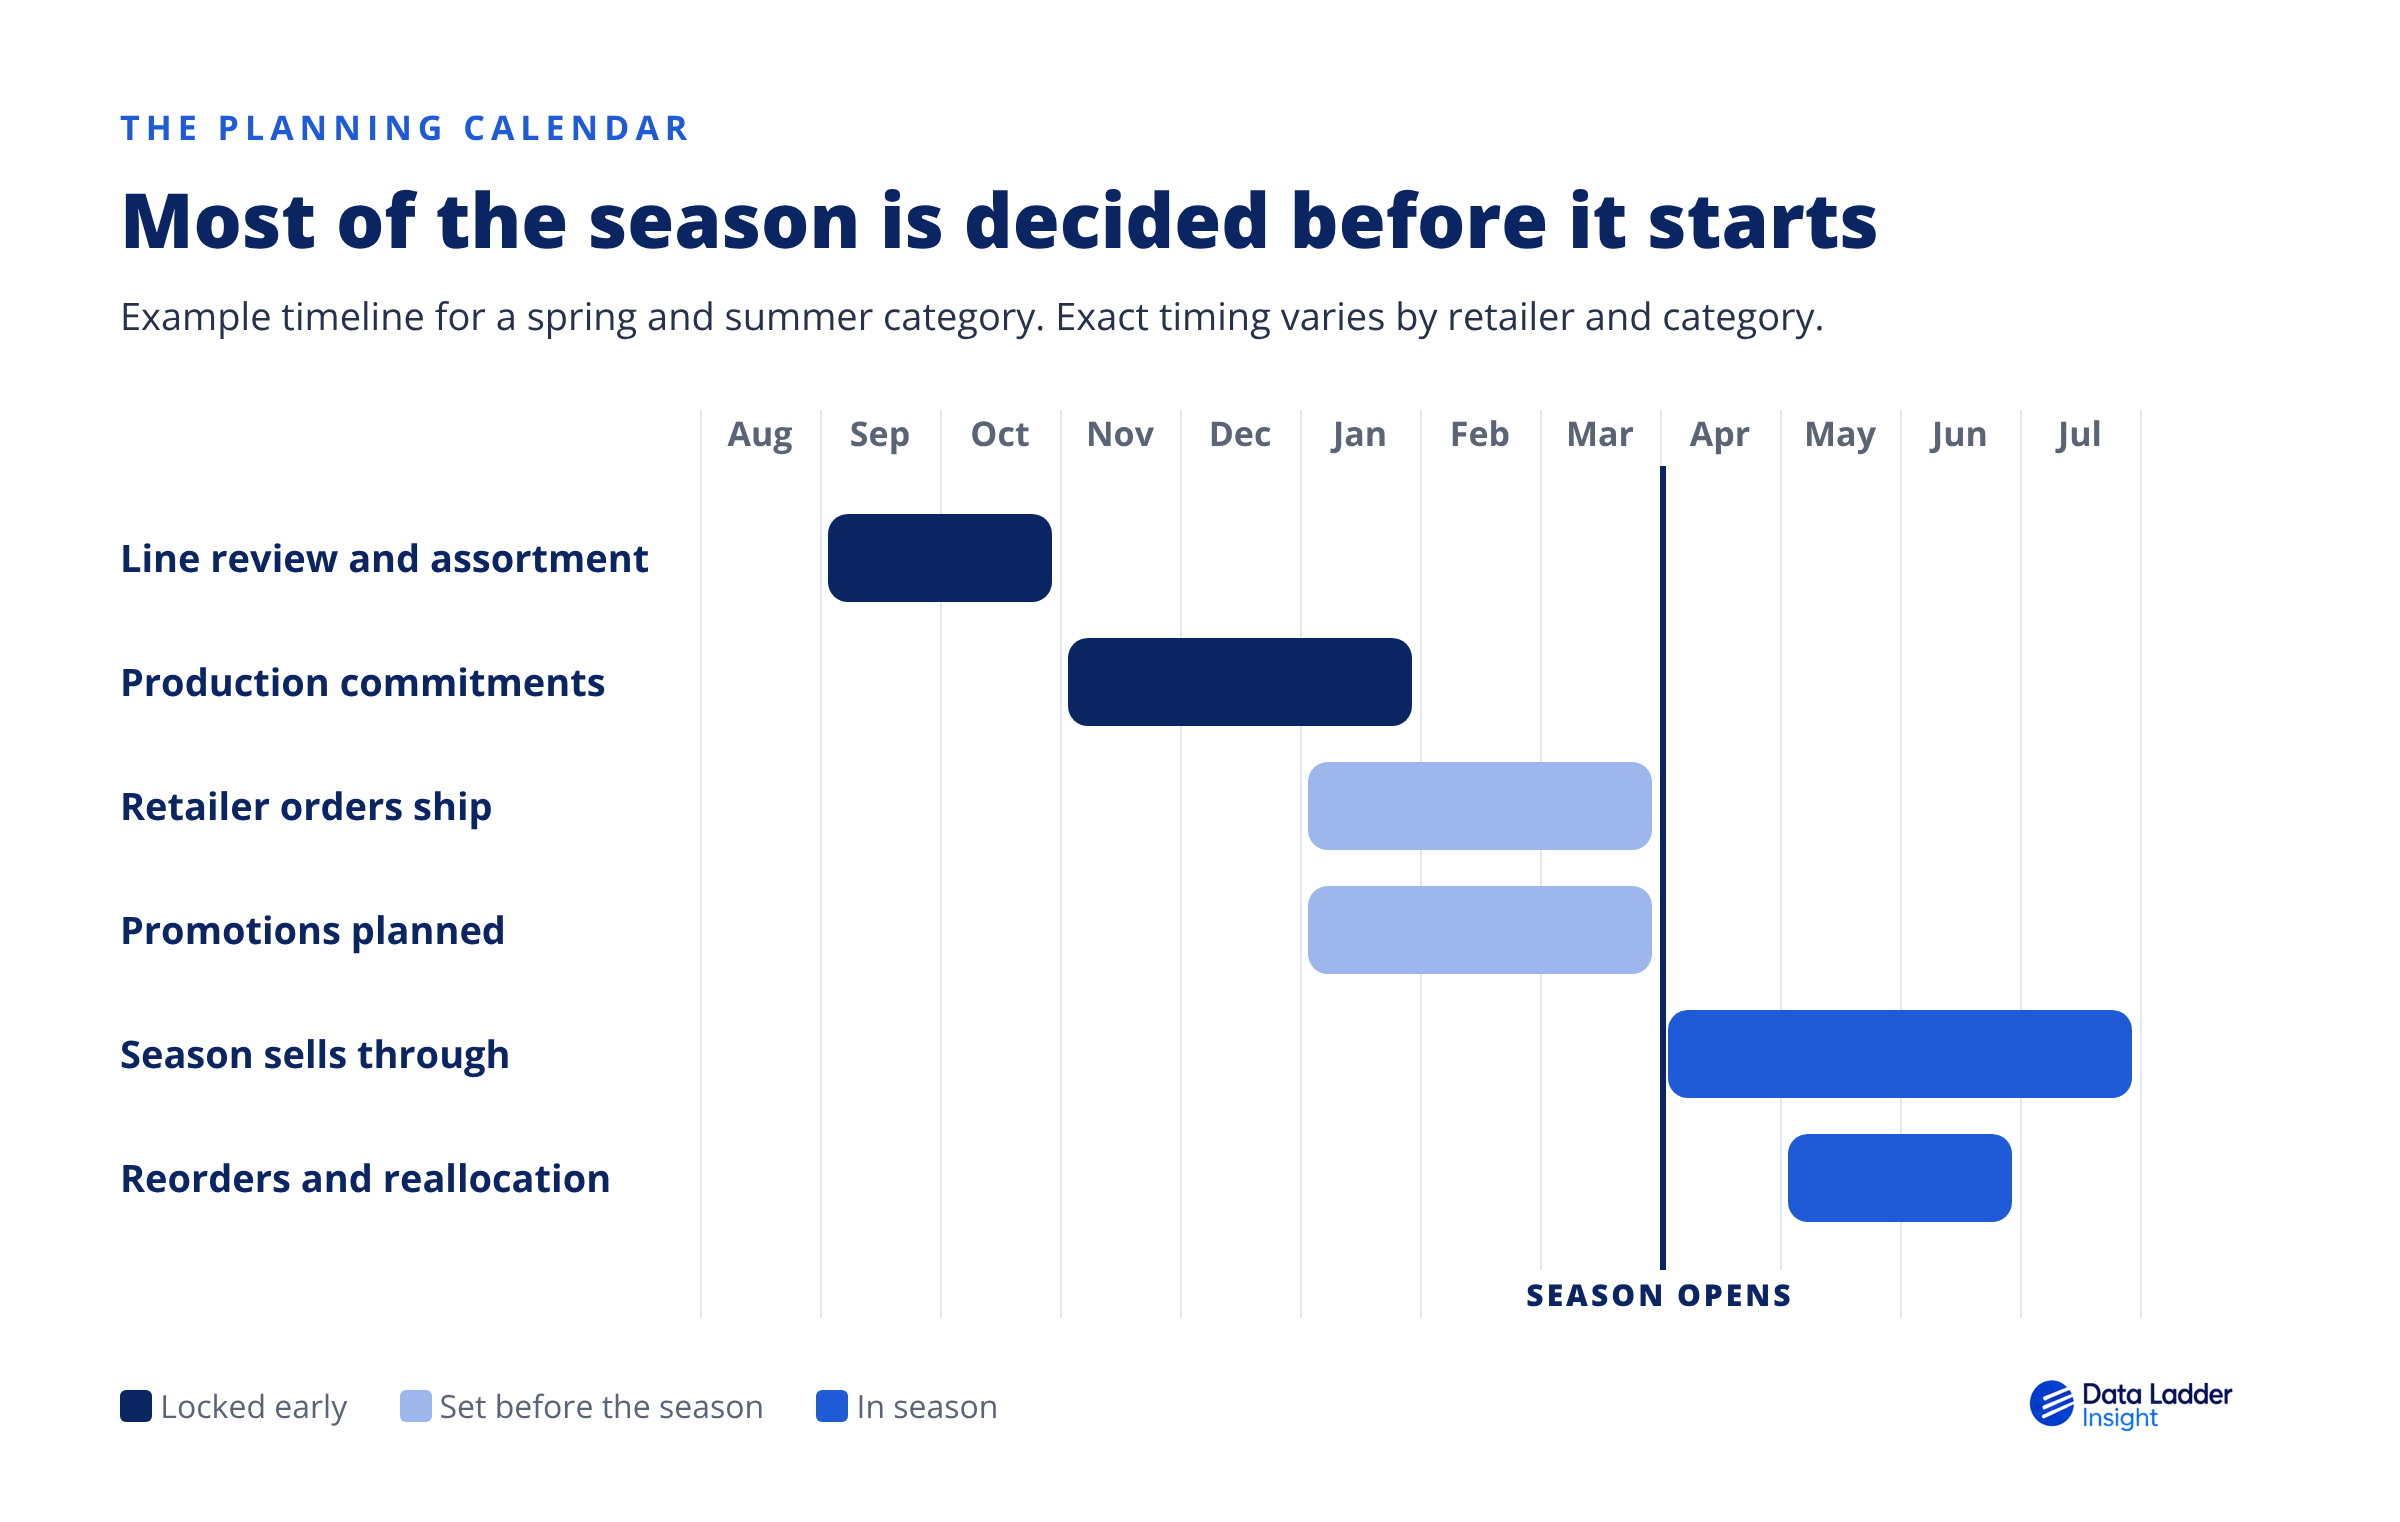
By the time the season opens, the remaining choices are smaller but still matter. You can change reorder quantities, move inventory between regions and retailers, adjust the timing and depth of promotions, and respond to a competitor's price. Those decisions are made week by week, and they're where a good in-season read pays off.
That gives a seasonal forecast two separate jobs. The first is setting the big commitments in the fall with the best estimate available. The second is telling you, as early as possible once the season opens, which way to move everything that's still flexible. Most planning processes put all their effort into the first job and treat the second as reacting to whatever happens.
Insight is built to handle both. Before the season, its demand forecasting projects SKU-level sales from seasonality and market changes, using store-level history rather than shipments. Once the season opens, the same daily data shows which way to move the decisions that are still open.
The default starting point for a seasonal forecast is last year's shipments, adjusted for growth. It's convenient, and it carries four distortions into the new season.
If a retailer drew down stock last spring, your shipments fell even if shoppers bought just as much. If they built inventory ahead of a promotion, shipments rose without any change in demand. A forecast built on shipments repeats last year's inventory swings as though they were demand.
If your product sold out in 300 stores for two weeks in May, last year's sales show what you had on the shelf, not what shoppers wanted. Lost sales leave no record in the shipment data, so a forecast built on it carries the shortfall into next year and makes the same stockout more likely.
A cold April pushes sales into May. A warm March pulls them forward. Using last year's monthly pattern as the template assumes the weather will repeat, which it rarely does.
A reset may have added a competitor's new SKU next to yours, cut one of your facings, or brought in a private label alternative. A forecast that ignores the new assortment is forecasting last year's shelf.
None of this means history is useless. It means the useful history is store-level sell-through, with stockouts and inventory changes accounted for, rather than a shipment total. Rolling multi-year averages make the problem worse, because they smooth the peak weeks into the rest of the year, which is exactly the detail a seasonal plan needs.
Insight puts that history in one place. You see store-level sales next to stock-out ratio and on-hand inventory for every SKU, so a weak week caused by empty shelves doesn't get recorded as weak demand, and a retailer's inventory drawdown doesn't look like a drop in shoppers.
In spring 2018, Home Depot's then-CFO Carol Tomé described April as "one of the coldest and snowiest months in more than 20 years". Garden sales slowed in one of the category's biggest months, and analysts at the time expected much of that demand to shift into later weeks rather than disappear.
That's the pattern a seasonal forecast has to plan for. Weather tends to change when people buy a new grill or a bag of mulch more than whether they buy one, and a late start compresses the season into fewer weeks. A forecast can get the season's total right and still miss badly week by week, which is what drives stockouts at the peak and leftover inventory at the end.
The start date also moves across the country. The season opens in Texas and Florida weeks before it reaches Minnesota, so a national forecast blends regions that are at different points in the season. A national promotion launched on one date will be early for some stores and late for others.
Two changes help. Forecast and track the season by region, so you can see it moving north instead of waiting for a national number to turn. And keep enough flexibility in inventory and promotion timing to follow the season rather than the calendar. A plan that assumes a fixed start date is only right in years when the weather cooperates.
DataLadder Insight tracks regional demand shifts daily, store by store. You can watch sell-through pick up in Texas and Georgia while the Midwest is still quiet, and move inventory and promotions north with the season instead of on a fixed national date.
The first two to three weeks of the season tell you more about how it will go than any forecast made the fall before. The value of that early read depends on two things: how quickly you see it, and whether you see it at the level where decisions get made, which is by store, region, and retailer.
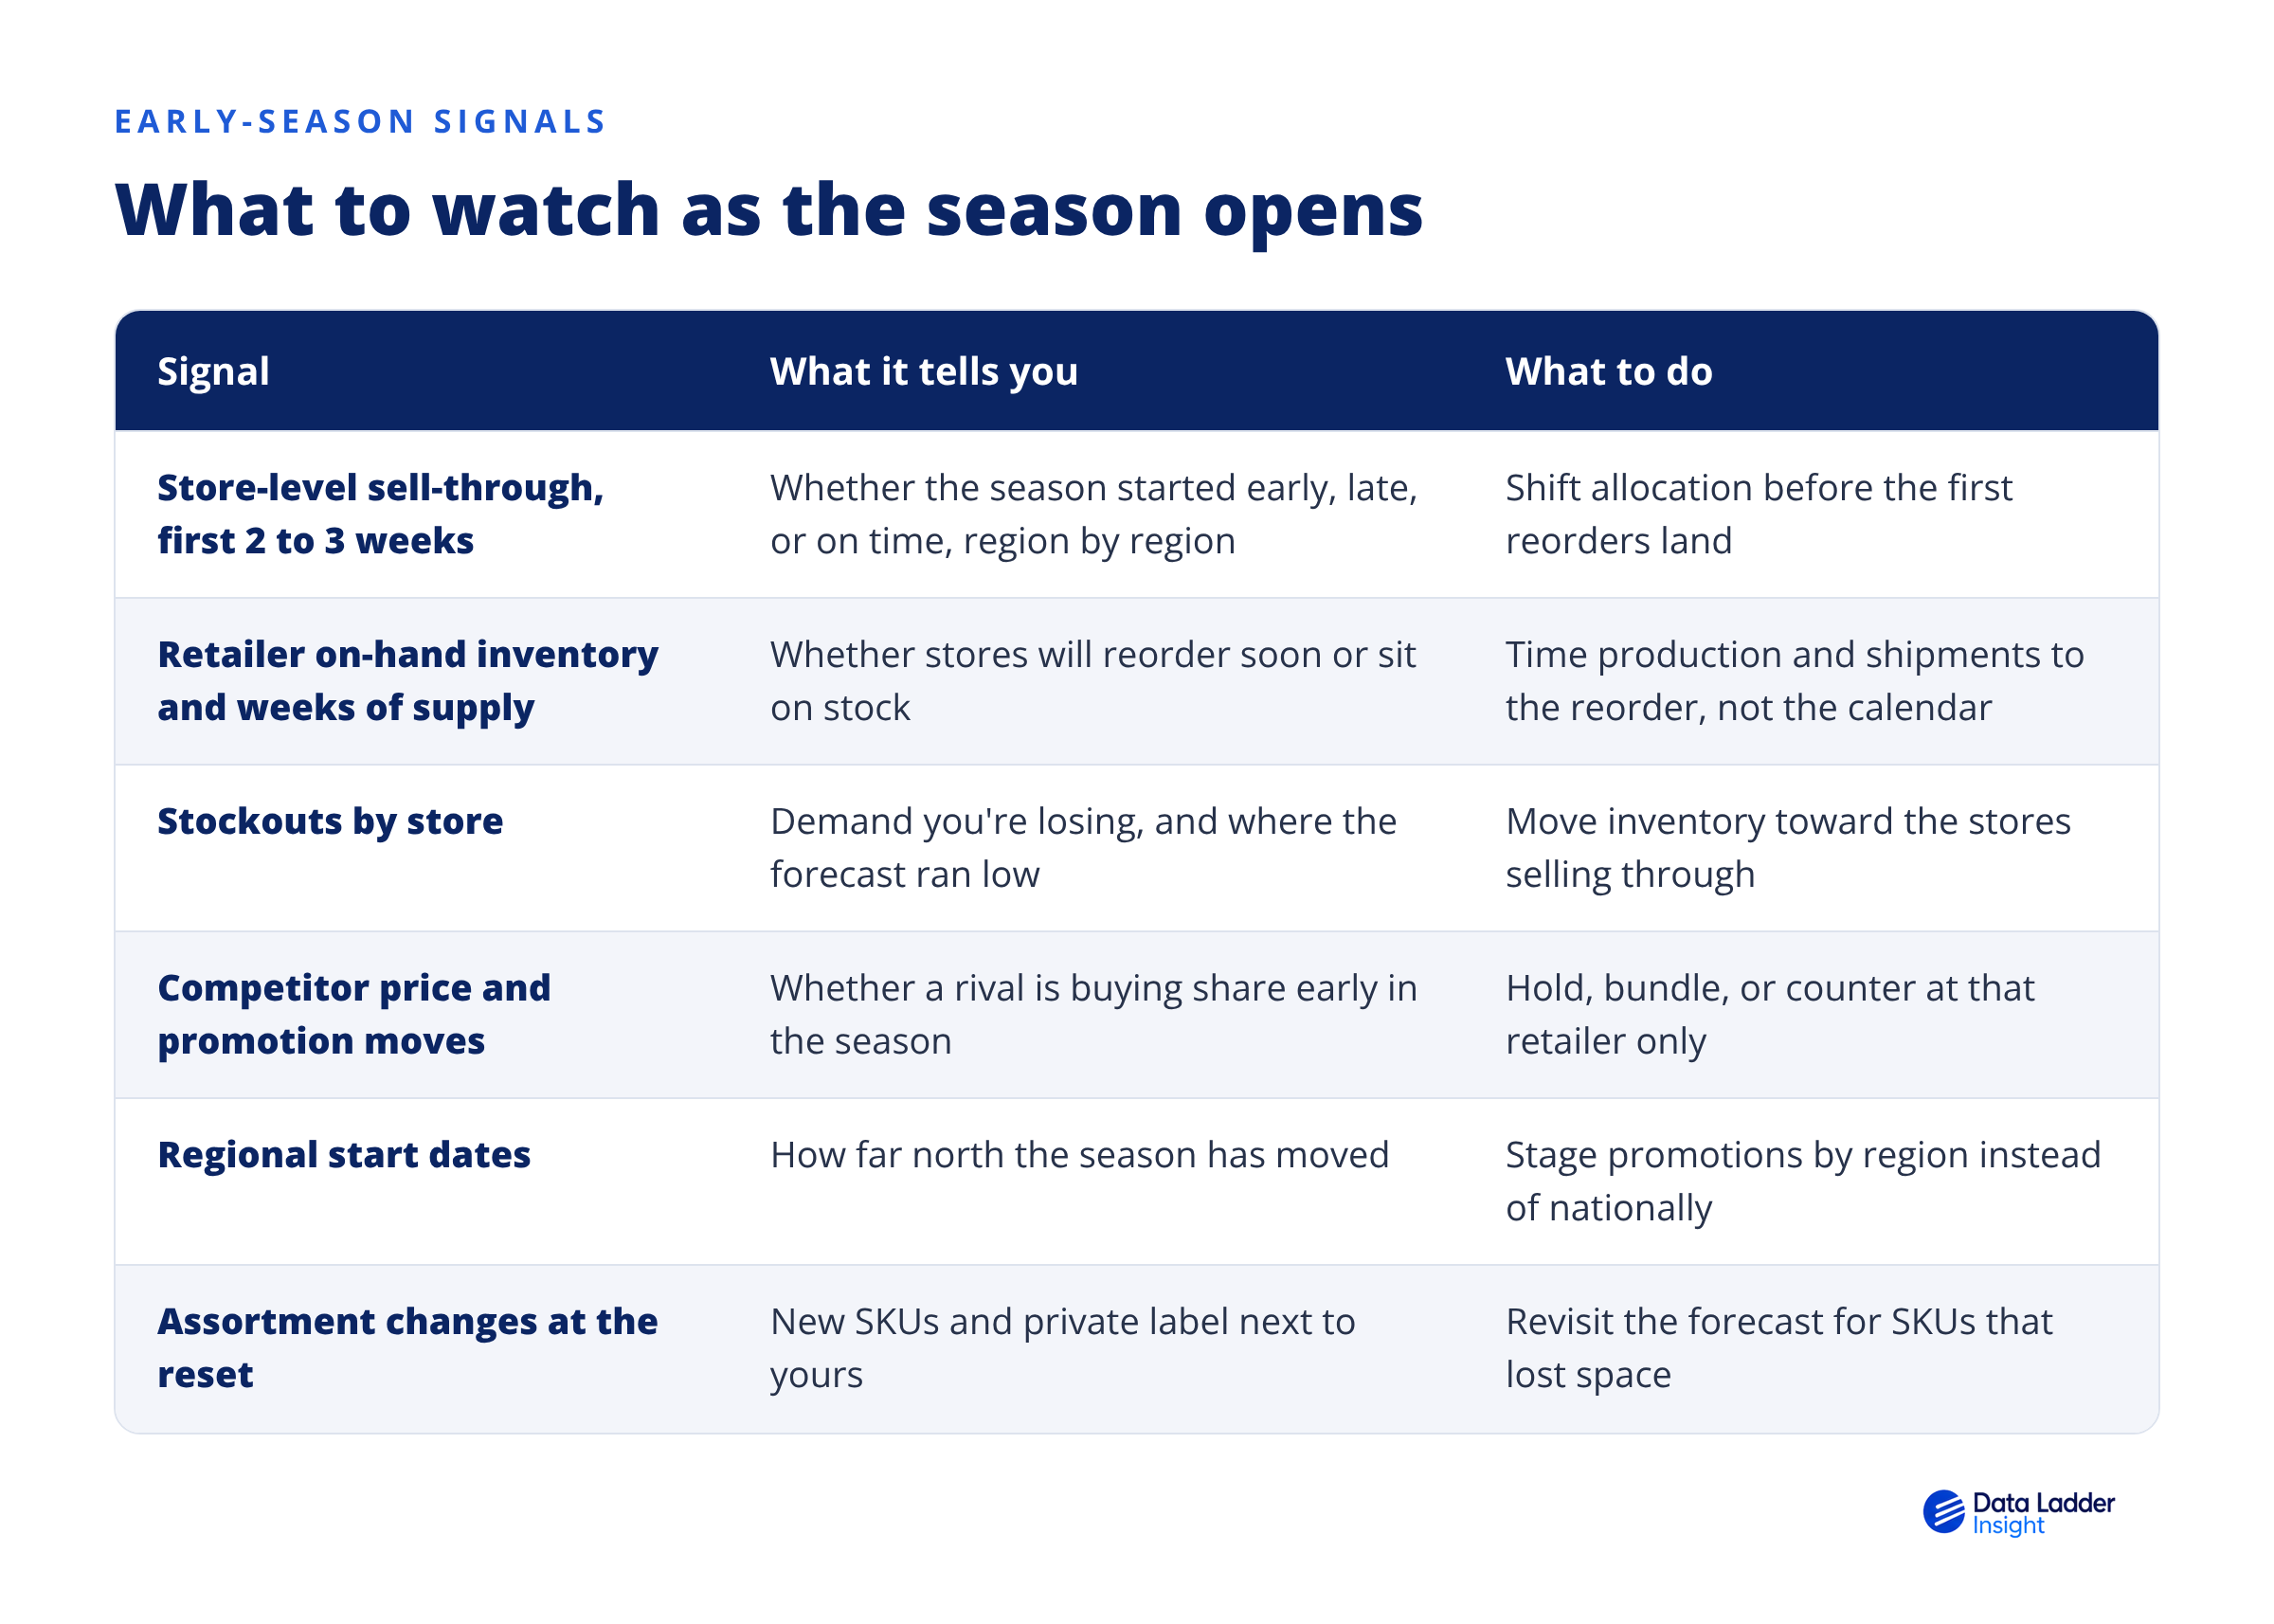
Sell-through and retailer inventory matter most, and they're best read together. Strong sell-through with high store inventory means the retailer can absorb the demand, and a reorder may still be weeks away. Strong sell-through with falling inventory means a reorder is coming soon, and possibly stockouts if supply isn't ready. Your shipment data shows neither until the order arrives.
Competitor moves deserve attention early for the same reason. In a short season, a rival who discounts in the opening weeks can take share you won't get back before it ends. Seeing that move at one retailer within days, rather than in next quarter's report, is what gives you time to respond at that retailer without cutting price everywhere.
Every signal in this table comes from the same kind of data: what's selling, what's in stock, and what it costs, at the store level, across retailers. Insight tracks all of it daily for every SKU, for your brand and your competitors, and flags pricing shifts, stockouts, and assortment changes as they happen. In practice, that means reading the season in its first week rather than at the end of the quarter.
A single-number forecast invites a single plan, and a single plan breaks the first time the season starts two weeks late. The manufacturers who handle a short season well plan for a range of outcomes and decide in advance how they'll respond.
Build three versions of the season around the start date, since that's the variable most likely to move. For each one, write down which regions get inventory first, when the first promotion runs, and how much inventory you hold back. When the season arrives, you're picking a plan you've already made instead of building one under pressure.
Insight's scenario planning lets you model each version, adjusting pricing, inventory, and distribution, and see the likely impact before you commit to anything.
Commit the volume you're confident in, and keep part of the rest flexible. That might mean unallocated inventory at your distribution center, products held at a stage where they can still be finished in a different configuration, or promotions with agreed fallback dates. The flexible share is what lets you follow the season rather than guess at it.
Decide ahead of time what sell-through in week two moves you into the early or late scenario, and who makes the call. Without agreed triggers, the first weeks of the season turn into a debate about whether the numbers are noise, and the window to act closes while the debate goes on.
With DataLadder Insight, the trigger is a number you can check every morning: daily sell-through by region and retailer, measured against the plan.
The back end of a season decides margin as much as the peak does. Watch how quickly sell-through falls off after the peak, by region, and make carryover and markdown decisions while there's still demand to sell into. Inventory that's still at retail when the season ends usually comes back to you as a markdown request.
At the end of the season, keep the numbers next year's forecast will need: store-level sell-through by week, stockouts, regional start dates, and competitor moves. Next fall's forecast will be much better built on those than on this year's shipment total.
Every step in this guide depends on one thing: seeing sell-through, inventory, and competitor moves at the store level, across retailers, fast enough to act while the season is still running. DataLadder Insight tracks pricing, inventory, and assortment for every SKU across 24,000+ U.S. retail and online locations, in both Pro and DIY channels, and refreshes it daily.
That puts the fall forecast, the scenario plans, and the in-season read on the same data. Insight projects SKU-level sales from seasonality and market changes before the season, models pricing, inventory, and distribution scenarios so the early, on-time, and late plans are ready, and shows you each morning which of those plans the season is following.
Before the season, Insight shows the category as it stands going into the reset, rather than as it looked last year. You can see revenue share and quantity sold share by SKU, store, and retailer, spot assortment gaps across Pro and DIY channels, and walk into the line review knowing where your brand is gaining or losing ground. That’s also where the forecast starts: projected sales built on what shoppers bought at each store, adjusted for seasonality and the latest market changes.
Once the season opens, the same data turns into an early-warning system. Insight flags stockouts as they happen, so you can move inventory toward the stores selling through before the empty shelf costs you the sale. It tracks competitor pricing daily, so a rival’s opening-weekend discount at one retailer shows up in days instead of in next quarter’s report. And because sell-through is visible by region, you can see the season moving north and time promotions to match.
It also gives the whole team the same view. Sales can bring store-level evidence to the buyer, supply chain can rebalance inventory against real sell-through instead of order history, and finance can see how pricing and promotions are affecting margin while there’s still time to adjust. When everyone works from the same daily numbers, the in-season decisions that usually stall in debate get made in time to matter.
After the peak, Insight helps you close the season out and set up the next one. You can measure performance by SKU and store, see how price changes affected demand, and spot which products slowed first so markdown and carryover decisions happen while demand is still there. Everything you learned this season, from regional start dates and stockouts to competitor moves, goes into next fall’s forecast as store-level history instead of a shipment total.
Seasonal demand forecasting in home improvement comes down to timing as much as volume. The total for the season matters, but the start date, the height of the peak, and the speed of the drop-off are what decide whether you're out of stock in April or marking down in July.
The manufacturers who come out ahead build their forecasts on what sold at the shelf, plan for more than one version of the season, and watch the first few weeks closely enough to change course while it still counts. Everyone else finds out how the season went when the retailer's next order arrives.
Wondering how seasonal demand forecasting can help your company sell more? Request a demo of Insight today to find out how we can help.
Seasonal demand forecasting estimates how much of a product shoppers will buy during a recurring peak, such as spring for garden and grilling or fall for heating products. For manufacturers selling through retail, it should estimate sell-through at the shelf by retailer and region, and answer three questions: when the season starts, how high the peak runs, and how long it lasts.
Shipments include retailers' inventory decisions, so a year when a retailer cut stock looks like lower demand. They also miss demand lost to stockouts, carry last year's weather into this year's curve, and ignore assortment changes made at the reset. Store-level sell-through, adjusted for stockouts, makes a better starting point.
Weather tends to change when shoppers buy more than how much they buy over the full season. A cold spring delays demand and compresses it into fewer weeks, which raises the risk of stockouts at the peak. The season also starts earlier in southern states than northern ones, so forecasts and promotions work better planned by region.
The most useful early signals are store-level sell-through in the first two to three weeks, retailer on-hand inventory, stockouts by store, competitor price and promotion moves, regional start dates, and assortment changes from the latest reset. Sell-through and inventory together show whether a retailer reorder is coming soon.
Build separate plans for an early, on-time, and late start, each with its own inventory allocation and promotion timing. Commit only the volume you're confident in, keep part of your inventory flexible, and agree in advance what week-two sell-through moves you to each plan, so decisions don't stall when the season arrives.
Data Ladder Insight tracks daily SKU-level pricing, inventory, and availability across 24,000+ U.S. retail and online locations, in Pro and DIY channels. Manufacturers use it to build seasonal forecasts on store-level sales instead of shipments, model pricing, inventory, and distribution scenarios before the season, and track sell-through, stockouts, and competitor moves by region once it starts.


Talk to our team about how SKU-level visibility can help your business.


Copyright © Insight 2026